For today’s business leaders, having access to timely, reliable information is key to making informed decisions. While organisations are collecting and processing increasing amounts of data, finding ways to effectively communicate and present the extracted insights remains a challenge.
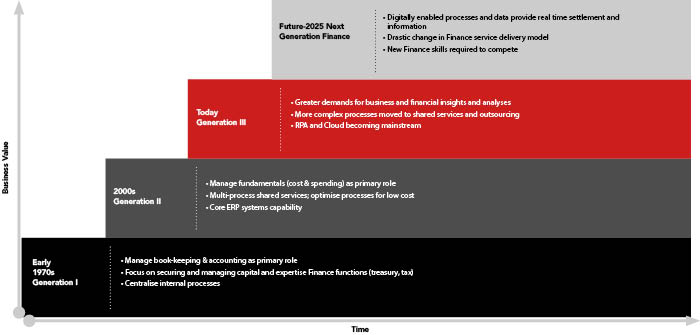
As technology and software progresses, we have seen the value of ‘bookkeeping’ skills decline and the importance of reporting and communication increase. This has been facilitated through the use of programs such as Xero, MYOB and other cloud-based ERPs (Enterprise Resource Planning), which have transformed and improved financial processes with their user-friendly platforms and speed.
The next step in the journey is visualising this data which is where dynamic visualisation or dashboarding programs such as Microsoft Power BI & Tableau come in. Through the power of dynamic dashboarding, these tools promise to provide deeper insights to users and further propel the accounting profession into the digital age.
In essence, these software applications provide a dynamic, user-friendly platform to turn data – both financial and non financial – into meaningful insights. Presented to the user visually, through charts, tables and graphs called visualisations, these come together to build dashboards which tell a story about the data. Each visualisation is highly customisable, and is able to draw on data from various different sources to display its findings.
From a pure data perspective, these visualisation tools have increased processing power and ability to handle large datasets. Their processing power allows users to seamlessly draw together multiple datasets, link them through common variables, and combine variables from all datasets onto a single visualisation. Gone are the days of having the prior year’s data on one screen and the current year on the other, trying to compare static reports that are only snippets of a complete story.
Perhaps the most compelling part of Dynamic Dashboarding is its interactivity and interconnectedness. No visualisation is static, i.e. more information can be presented by clicking on the bars of a bar chart, or hovering over certain elements to show further detail. Furthermore, each visualisation on the page can be influenced by those around it. Let’s consider a company looking into the demographics of its customer base. They have a column chart detailing the ages of the customers and a pie graph showing what percentage lives in certain areas. A user could click on a suburb shown in the pie graph, which would then influence the column chart to only show the age distribution of people who lived in that suburb. This allows users to deep dive into their data, while minimising the number of charts and graphs that are displayed. ‘Slicers’ can also be used to change what is displayed on the dashboard. Using our location example, different territories could be selected from the slicer and the data viewed on a single dashboard. This is in contrast to tools like PowerPoint, which would need multiple slides to display the information for each location.
The reports produced are versatile. The insights can be a key component in management decision making. Although, the detail and analysis availability is largely dependent on the quality of the data collected. The level of detail that the reports allow mean managers can drill down into the data to find trends and track progress against certain metrics. At the same time, the reports can be used to provide overviews at board meetings, where the appeal and simplicity of the visualisations allows high level information to be communicated effectively. This adaptability has meant such reporting tools have become both relevant and essential at all levels of business.
For large groups, Dynamic Dashboarding can make tracking and comparing between members of the group much more simple. As an example, a group of companies with similar charts of accounts could be tracked from the same dashboard, allowing a user to quickly switch between companies and make meaningful comparisons.
From an efficiency standpoint, Dynamic Dashboarding allows for models to be refreshed automatically as new data comes in. This is because the visualisations are based on formulas, allowing users to benefit from updated information without having to make changes. Updates to the model are generally only needed when the type of data changes, or the user is wanting new information to be shown.
From an accounting perspective, this is transforming the way we are able to communicate financial information to our clients and their stakeholders. For example, through linking platforms such as Power BI or Tableau with Cloud based-ERPs like Xero or MYOB,, information can flow through to create live, interactive reports. This can make things like tracking expenses and examining performance ratios both simple and more effective. Unlike other reporting software, the data updates flow through from Xero or MYOB in real time, allowing for up to date analysis.
Software like this also allows us to extend beyond the typical financial reporting clients might expect. It can be used to visualise all types of data. For example, a business may wish to conduct a demographics analysis on their customer base, or present the results of a survey in an effective, insightful way. This allows those who provide financial reporting services to their clients to extract more value and utilise data that before, due to their inability to derive insights, may have been meaningless.
Overall, Dynamic Dashboarding provides the tools to extract value from data in a multitude of new ways. We expect this software to become more prevalent within businesses of all sizes, and quickly becoming essential as a reporting tool in today’s technology- enabled world. In any case, there is no doubt that it will influence the way we work, and will further fuel the demand for deeper analysis and insights.


